Target Dashboard
View memory trends, commit history, and health indicators for a single target.
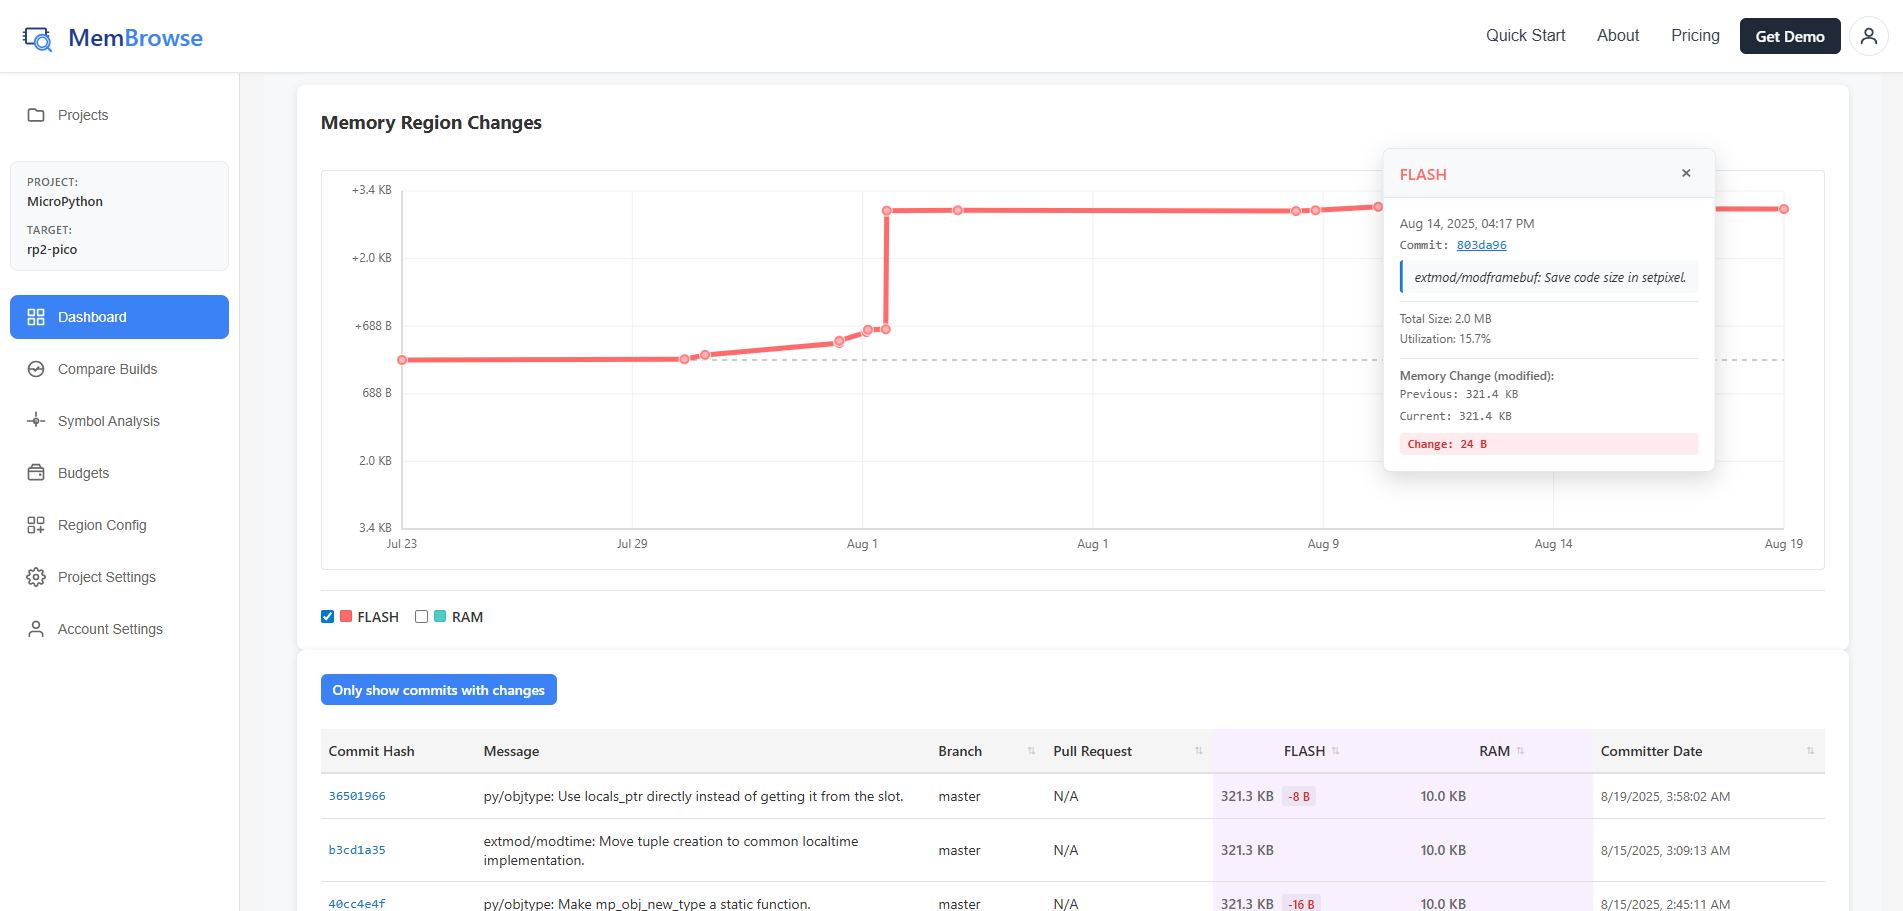
The target dashboard gives you visibility into memory trends over time, helping you:
- Spot regressions early: See memory spikes the moment they are introduced
- Track optimization progress: Verify that refactoring efforts actually reduce memory usage
- Switch between targets: Use the sidebar to quickly compare memory across different build targets or feature flags
Branch Selector
Use the branch selector dropdown at the top to switch between branches, tags, and pull requests. The dashboard updates to show commits and trends for the selected branch.
Memory Health
The health widget shows horizontal utilization bars for each memory region. Each bar displays the region name, used vs. total bytes, and utilization percentage, color-coded by health (green, yellow, or red).
Memory Region Changes Chart
A time-series line chart tracks memory usage across commits. Each memory region is shown as a separate line. Hover over a point to see commit details, or click a point to navigate to that commit's comparison view.
Commit History
A paginated table showing all analyzed commits, with:
- Commit hash (clickable) and message
- Author and timestamp
- Memory change delta (colored + or -)
- Total memory size
Use the "Show only commits with memory changes" toggle to hide commits where memory stayed the same.
Click any commit row to view its detailed memory breakdown.