Getting Started with MemBrowse
MemBrowse is a firmware memory analysis platform that tracks your RAM and Flash usage on every commit. Integrate it into your CI/CD pipeline to catch memory regressions before they ship.
What You'll Get
After completing this guide, you'll have:
- Automatic memory tracking on every commit to your main branch
- PR comments showing exactly how much memory each change adds or removes
- Historical trends to visualize memory usage over time
- Target comparison to understand how different boards and configurations differ
- Budget alerts that fail CI when memory exceeds your limits
Why Track Memory?
Embedded firmware has hard memory limits. When you run out, the build fails or the device crashes. Without continuous tracking:
- Memory regressions slip in unnoticed until you hit the limit
- Optimizations are hard to verify without before/after data
- Teams waste time debugging "it worked yesterday" issues
MemBrowse gives you the same visibility into memory that code coverage tools give you for tests.
Quick Start
1. Create Your Account
- Go to membrowse.com and sign up
- Click "New Project" on the portal
- Enter your project name and description
- Click "Create"
Your API key will be displayed immediately after project creation. Copy and save it securely. You will need it for uploading reports.
2. Integrate with Your CI
Choose your integration method:
- GitHub Actions - Native support with ready-to-use workflows
- GitLab CI - Native support with a reusable CI/CD template
- Other CI Systems - Integrate with Jenkins, Azure Pipelines, and more
3. View Your Portal
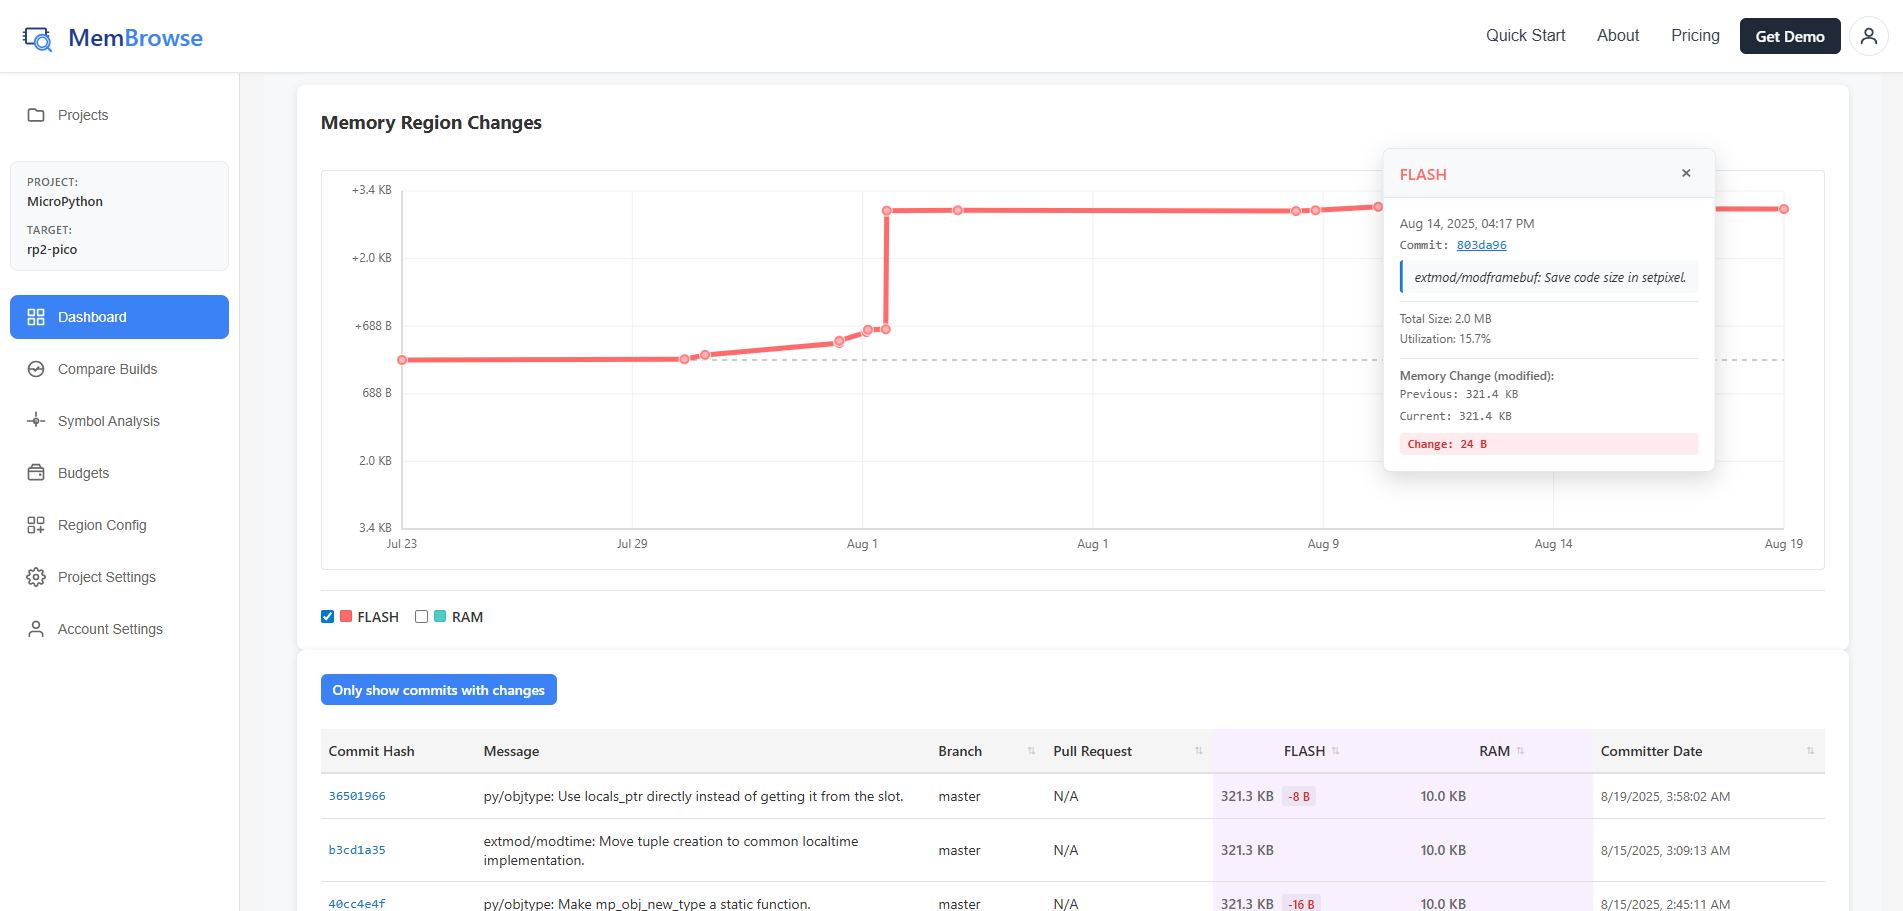
After your first report uploads, visit your project portal to:
- View memory trends over time
- Compare commits side-by-side
- Compare memory usage across different targets
- Identify which symbols use the most memory
- Set memory budgets and alerts
4. See PR Comments
Once your CI workflows are set up, MemBrowse posts a comment on each pull request showing the memory impact of the change. You can also configure memory budgets to fail PRs that exceed your limits.
What Gets Uploaded?
MemBrowse analyzes your ELF files locally in your CI environment. Your source code never leaves your infrastructure. Only JSON reports containing:
- Symbol names, sizes, and addresses
- Section information
- Memory region usage
are uploaded to the MemBrowse platform.
Next Steps
- How It Works - Understand how MemBrowse works
- GitHub Actions Integration - Set up your CI pipeline with GitHub Actions
- GitLab CI Integration - Set up your CI pipeline with GitLab CI/CD
- Other CI Integration - Integrate with Jenkins, Azure Pipelines, and more
- Using the Portal - Navigate the dashboard, analyze symbols, and compare builds